The Japanese statistics and systems in this article were checked on 23 October 2026 against pages from the Statistics Bureau, the Bank of Japan and the Financial Services Agency. The book parts are my own summary, written after reading the introduction and chapter 1 that Piketty himself posts online.
The short answer
- r > g means the return on capital (r) is higher than the growth rate of the economy (g). The French economist Thomas Piketty argued it in Capital in the Twenty-First Century from long historical data. It is a claimed tendency, not a law of nature.
- The book explains that when r stays above g for a long time, wealth already owned tends to grow faster than income earned by working. Piketty himself writes that a long stretch of r above g is more likely when growth is low, but not automatic.
- Japanese official statistics do not give one number for Japan’s r. So this article does not say r > g holds in Japan.
- What is certain is the arithmetic of compounding. Time helps, but at lower returns the person who starts earlier does not always win.
- This is not an article telling you to invest. It explains why the Grow skill exists, and leads to risk, fees and the long view.
Once you see this, you can check for yourself, with numbers marked as assumptions, the difference between saving from wages alone and having assets that work. You do not have to take a popular story’s numbers on trust.
You may have seen r > g and wondered what it means for your life in Japan. Your pay arrives every month, yet savings seem to grow more slowly than you expected. The formula offers one way to look at that. It also has critics, and this article puts both side by side.
- What is r > g? The formula Piketty put forward
- Why do wages alone let gaps open?
- What do households in Japan hold their assets in?
- Objections and criticism: why not take the formula at face value
- How compounding works: what “time on your side” means
- When starting early and long helps, and when it does not
- Know when to stop: which one are you?
- FAQ
- Summary
- Read next
What is r > g? The formula Piketty put forward
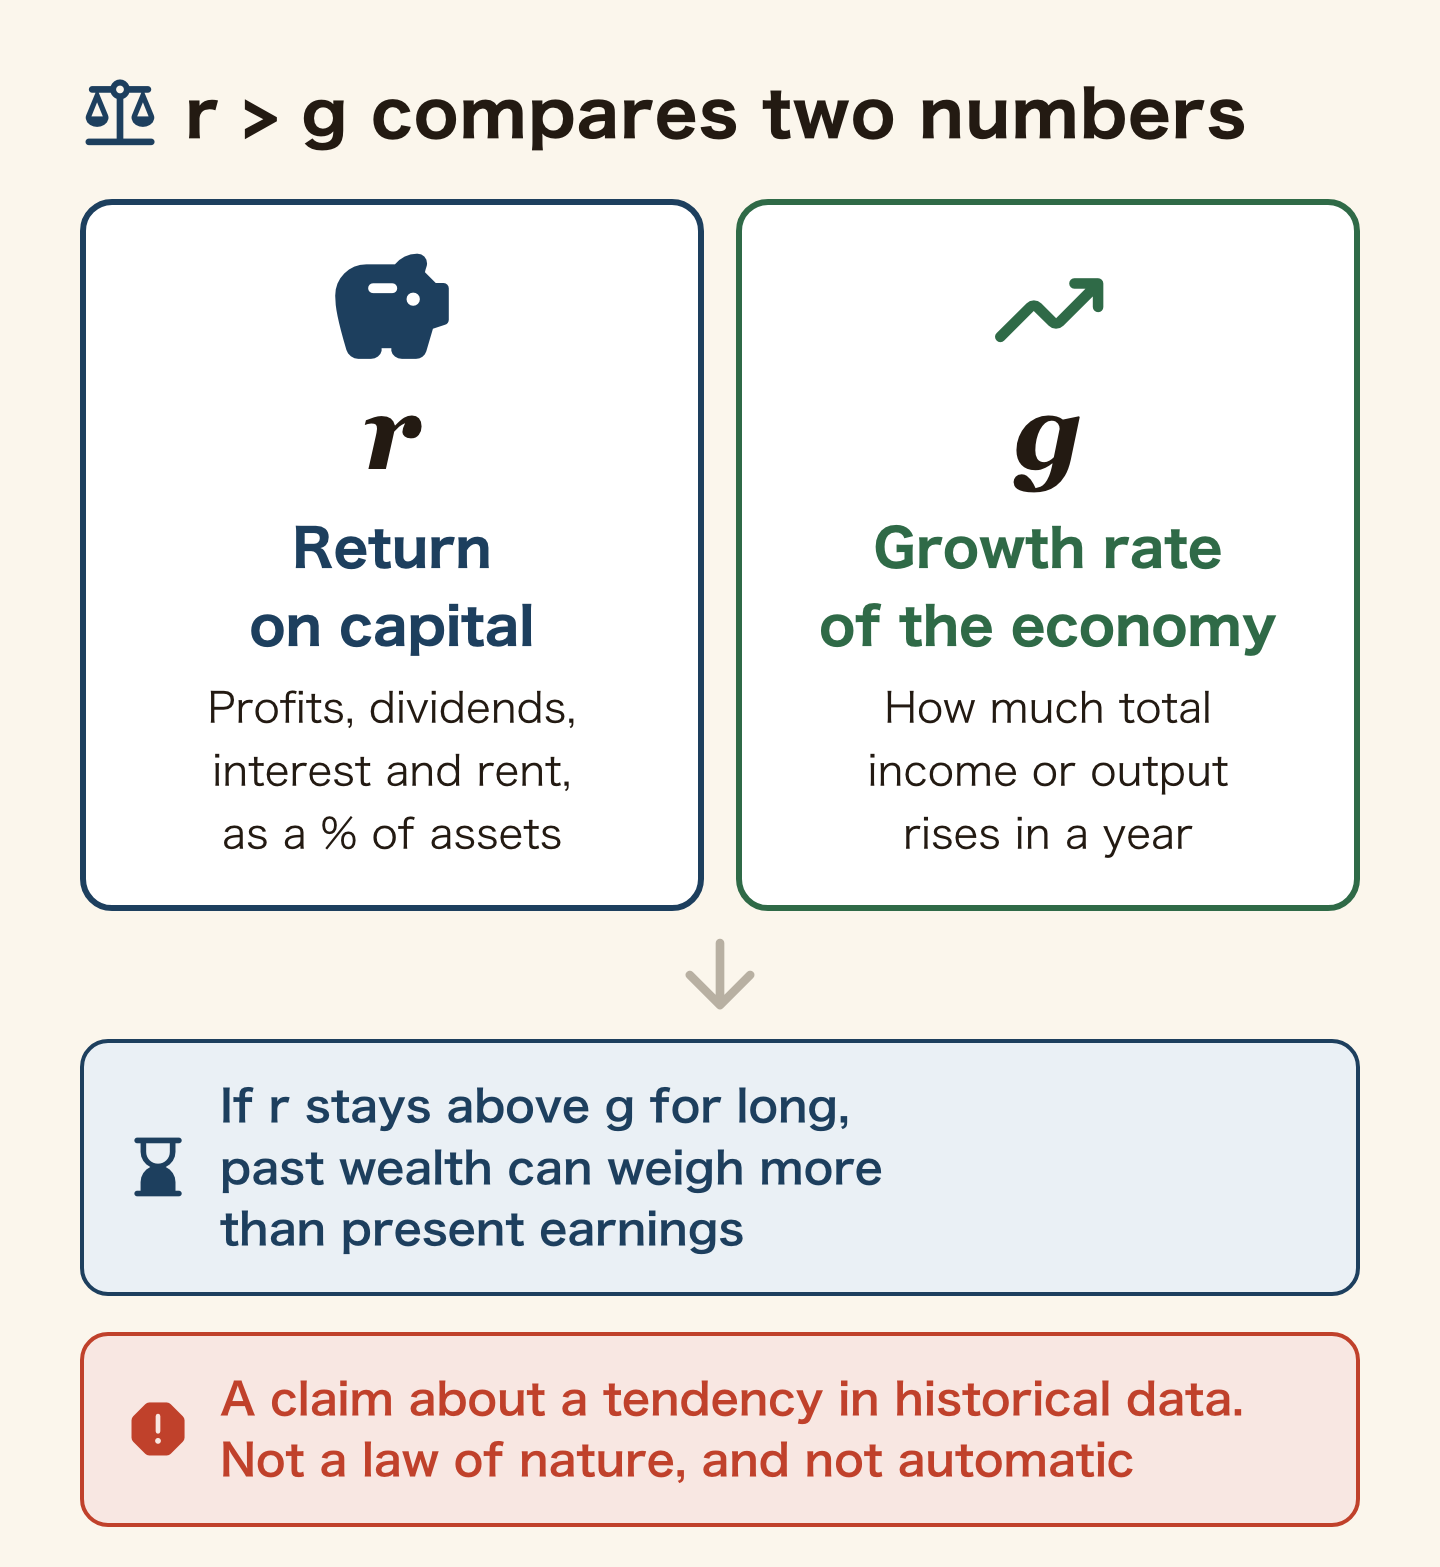
r > g compares two numbers. r is the yearly return on capital: profits, dividends, interest and rent, as a share of the value of the assets. g is the growth rate of the economy, meaning how fast a country’s total income or output rises in a year.
The book explains that when r stays well above g for a long time, wealth built up in the past can matter more than the income of people working today. The tendency is described as stronger in slow-growth societies.
In the same chapters, Piketty writes that a long stretch of r above g is more likely when growth is low but not automatic, and that what he describes is a growing risk of divergence, not a certainty. He also points to forces that pull the other way. So r > g is a claim about a tendency seen in historical data, not a rule that always holds.
When this article describes the book, it says “the book explains that…”. Japanese statistics and systems go in separate paragraphs and use only what an official page confirms.
Why do wages alone let gaps open?
In the book’s view, income from work tends to rise at about the pace of the economy. A raise of a few percent a year is already a good one. Returns on assets, by contrast, add to the assets themselves at the pace of r. If r is higher than g, people who already hold assets can pull ahead.
This is not the conclusion that people who live on wages are doomed. The book talks about how wealth is distributed across a whole country. It does not decide your own future.
Japanese statistics do show that asset holdings differ. In the 2024 National Survey of Household Structure (Statistics Bureau, published 28 August 2026), the average for all households, including those with no financial assets, was 15.272 million yen. Separately, the median among households that do hold financial assets was 7.28 million yen. The two are counted differently, so they cannot be compared directly, but the same document confirms that the distribution leans toward small holdings. By age of the household head (average, including households with none), it was 3.157 million yen where the head is under 30 and 23.365 million yen where the head is in their 60s.
All this supports is that asset levels differ quite a lot between Japanese households. Assets rising with age can also be explained by years of saving. These figures alone cannot show that r > g is the cause.
What do households in Japan hold their assets in?
Japanese households have a distinctive place for their money. In the Bank of Japan’s comparison of Japan, the US and the euro area (31 August 2026), household financial assets in Japan were 47.2% cash and deposits, 16.7% shares and equity, and 6.9% investment trusts. In the US they were 10.7% cash and deposits, 43.4% shares and equity, and 13.3% investment trusts. In the euro area, 31.1% cash and deposits and 25.5% shares and equity.
These show how holdings differ between countries, not which way is correct. Cash and deposits keep the principal steady. Shares can move a lot in price.
Prices matter too. In the Statistics Bureau’s consumer price index (2025 = 100), the all-items figure for September 2026 was 102.2, up 2.1% from a year earlier. If deposit interest does not keep up with such a rise, the amount your money can buy shrinks. The reasons are laid out in Should Foreigners Invest in Japan?. Read it before you judge whether savings alone are enough, and you will see where the numbers come from.
Objections and criticism: why not take the formula at face value
Economists have pushed back on r > g. Here is the honest version.
The first is how to measure net returns. In a 2015 paper, Matthew Rognlie subtracted depreciation, the value that machines and software lose. He found that across seven advanced economies including Japan, the long-run rise in the net capital share is concentrated in housing. He concludes that concern about inequality should shift toward other aspects of distribution, such as the distribution within labor income.
The second is cause. In a 2014 paper, Daron Acemoglu and James Robinson argue that political and economic institutions matter more than the gap between r and g in shaping how inequality moves.
The third is applying it to Japan. The book draws on a long history from about twenty countries. Among the sources I checked on 23 October 2026, I found no official Japanese statistic that boils household assets and returns down to a single r. The Gini coefficient in the household survey (0.286) measures income differences, not wealth.
In short, r > g is a useful tool for thinking. This article has no basis to say that it is happening in Japan right now.
How compounding works: what “time on your side” means
From here it is arithmetic, not opinion. Compounding means adding the gains to the principal and investing again (Financial Services Agency, “Basics of asset building”). Gains earn gains, so the longer the period, the wider the gap.
This table assumes a single 1 million yen deposit that is never withdrawn, with no fees or tax.
| Assumption: 1M yen, annual rate | 10 yrs | 20 yrs | 30 yrs | 40 yrs |
|---|---|---|---|---|
| 3% a year (assumption) | 1.34M yen | 1.81M yen | 2.43M yen | 3.26M yen |
| 5% a year (assumption) | 1.63M yen | 2.65M yen | 4.32M yen | 7.04M yen |
Multiply 1.03 by itself 40 times and you get 3.26. Do the same with 1.05 and you get 7.04. A calculator will confirm it. These are assumptions only. Real results rise and fall from year to year, and you can lose principal.
A parable often told in Japan: Jack and Jill
A parable like the following is often retold in Japan. It appears in several blogs, but I have not checked the original, so I do not name a source. The names are characters in the story.
Younger brother Jack saves 50,000 yen a month from age 18 to 25, only eight years, then leaves it alone. Older sister Jill saves 50,000 yen a month from 26 to 65, forty years. At an assumed 10% a year, Jack ends up ahead at 65.
I recomputed it with 50,000 yen deposited at each month’s end, the annual rate converted to a monthly rate and compounded monthly, the value at the end of age 65, and no fees or tax. The 1-million-yen table above compounds once a year.
| Assumed annual rate | Jack (4.8M yen paid in) | Jill (24M yen paid in) |
|---|---|---|
| 0% (assumption) | 4.80M yen | 24.00M yen |
| 3% (assumption) | 17.64M yen | 45.86M yen |
| 5% (assumption) | 41.25M yen | 74.13M yen |
| 10% (assumption) | 324.54M yen | 277.52M yen |
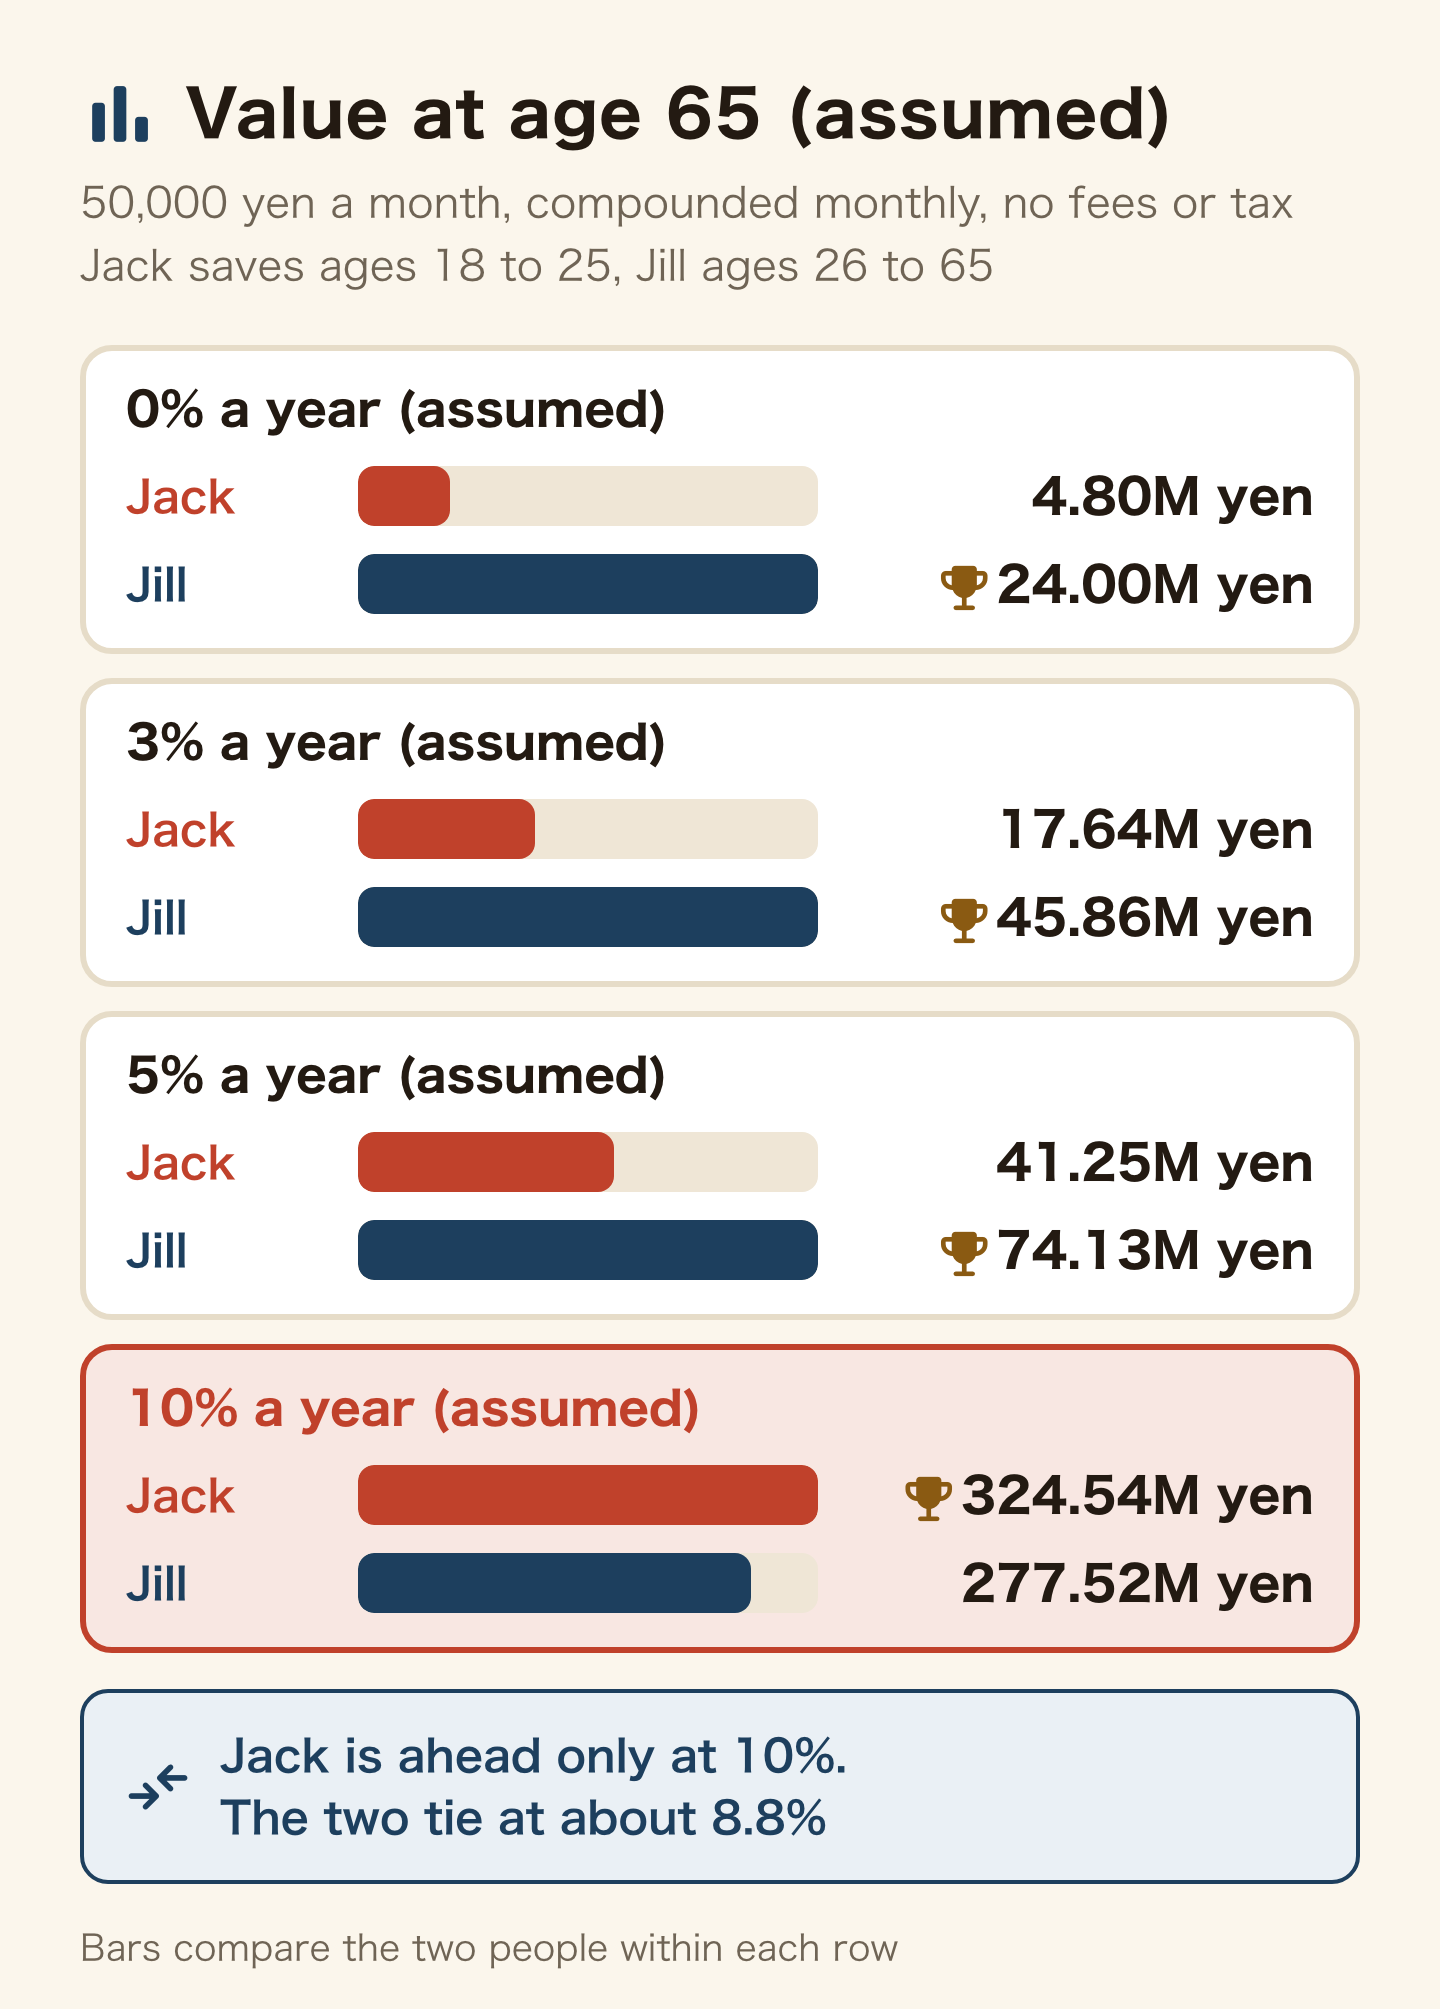
Only at 10% does Jack come out ahead. In this calculation the two cross at about 8.8% a year. As an average over a long period, 10% is a very high assumption. At 3% or 5%, Jill wins. The parable does not show that whoever starts first always wins. What it shows is a property of the arithmetic: the higher the return, the more the early deposits count.
Compare the same 50,000 yen a month paid from 18 to 65 (48 years) against 26 to 65 (40 years). At 3% it is 63.50M yen against 45.86M yen, and at 5%, 115.38M yen against 74.13M yen. With all else equal, starting earlier is better. But “all else equal” means no withdrawals, no loss of principal, and small fees.
When starting early and long helps, and when it does not
As arithmetic, a longer time makes compounding stronger. The Financial Services Agency also explains that long holding periods increase the compounding effect. The same page says investing can lose principal. Buying in regular amounts over time and holding different assets are introduced as ways to smooth out price swings.
Fees change the result too. The FSA’s “Oshiete Mushitori Sensei” explains that an investment trust’s management fee is taken a little at a time while you hold it. Even a small rate, taken every year for a long time, becomes a difference in the final amount. Some products also charge a fee at purchase.
Not withdrawing is a condition as well. The calculations assume you never spend the money. Whether you can avoid touching invested money when cash is suddenly needed lies outside the arithmetic, in the conditions of your life.
For foreign residents, the length of stay in Japan is one more condition. What happens to invested assets when you leave depends on the system. How to open an account, and what happens when you go home, are in NISA for Foreigners in Japan 2026. Read it before deciding to start, so you know the exit conditions first.
Know when to stop: which one are you?
- Your living costs are tight and you have no emergency cash yet: finish reading, and start nothing today. Build Protect and Save first. So that you do not lose money before you can grow it, read Scams in Japan 2026 and learn how to spot an investment lure on social media.
- You have savings but feel uneasy about growing them: the unease has a shape once you know principal loss and fees. Read the FSA pages. Decide after you understand.
- You already invest and assume a high yearly return: rerun the 3% and 5% rows in this article. A plan that depends on a high assumption should be rebuilt.
- You will be in Japan only briefly and plan to go home: before you invest, check how assets are treated when you leave.
You do not need to start right now. Understanding the mechanism and deciding not to start is also a sound decision.
FAQ
Q. What is r > g?
It says the return on capital (r) is higher than the growth rate of the economy (g). The French economist Thomas Piketty put it forward in Capital in the Twenty-First Century, as a tendency seen in long historical data. It is not a law of nature, and he writes that a long stretch of r above g is more likely when growth is low but not automatic.
Q. Does r > g apply to Japan?
This article does not claim that it does. Among the official statistics I checked on 23 October 2026, none boiled Japanese household assets and returns down to one r. Researchers also disagree about estimation methods and the role of institutions.
Q. Why do wages alone let gaps open?
The book explains that income from work tends to grow at the pace of the economy while returns on assets can grow faster. This is a tendency across a whole country and does not decide your own result.
Q. Is a 10% yearly return realistic?
As a long-run average it is a very high assumption. As the table shows, at 5% the Jack and Jill story reverses. When you plan, check with lower assumptions.
Q. Does this article recommend investing?
No. It explains how the arithmetic works and the conditions around risk, fees and exit. Investments can lose principal, and whether to start is your decision once you understand them. No individual products are named.
Summary
r > g is Piketty’s claim from historical data that the return on capital exceeds the growth rate. It is not a law, and it has critics. I could not confirm an official statistic that gives a single r for Japan. What is certain is the arithmetic of compounding: longer helps, but at an assumed 10% the conclusion can flip. At 3% and 5%, Jill, who started later and kept going, came out ahead.
The Grow skill sits on top of Protect, Save and Earn. The overall order is in the 5 Skills, and the entry point for Grow is the Grow page.
Sources (official and primary), all checked on 23 October 2026: Statistics Bureau, National Survey of Household Structure 2024, summary of results / Bank of Japan, flow-of-funds comparison of Japan, US and euro area / Statistics Bureau, Consumer Price Index / FSA, Basics of asset building / FSA, Oshiete Mushitori Sensei, part 6. Systems and documents can change. The book parts rest on Piketty, Capital in the Twenty-First Century, introduction and chapter 1 (English, posted by the author). Criticism: Rognlie (Brookings, 2015) and Acemoglu and Robinson (2014). The Jack and Jill figures are my own calculation under the stated assumptions.
Read next
Found this useful? Share it
Send it to a friend who lives in Japan.
WHO WROTE THIS

mori
Japanese. I read the ministries’ own notices, orders and Q&As in the original, and I start from what my Nepalese and Sri Lankan friends in Japan actually ran into. I do not write about what I have not checked or been told.
What this site can and cannot do →Looking for something else?
You may use the figures in this article, including commercially, if you credit this site with a link. How to use our figures